


Mazda Motor Corporation’s stock has rebounded toward its 52‑week highs after a sharp late‑March selloff, closing at ¥1,093 on September 24, 2025. The cash-rich balance sheet (¥1.01T cash vs. ¥716.59B debt) and positive free cash flow (levered FCF ¥102.44B) underpin a 4.94% forward dividend yield ahead of the September 29 ex‑dividend date. Fundamentals remain mixed: trailing 12‑month revenue is ¥4.91T, but quarterly revenue growth is down 8.8% year over year, the operating margin is negative (‑4.19%), and net margin is slim (0.45%). Valuation screens as value‑oriented with price‑to‑book of roughly 0.4x and price‑to‑sales near 0.14x based on reported metrics. With a low beta (0.48) and liquidity support (current ratio 1.52), the setup is about execution—stabilizing sales and repairing margins—against an industry backdrop that remains uncertain into the fall selling season.
Key Points as of September 2025
- Revenue: TTM ¥4.91T; quarterly revenue growth (yoy) −8.80%.
- Profit/Margins: Net margin 0.45%; operating margin −4.19%; EBITDA ¥207.3B; diluted EPS ¥180.91.
- Sales/Backlog: Revenue per share ¥7,794.53; snapshot does not include order backlog.
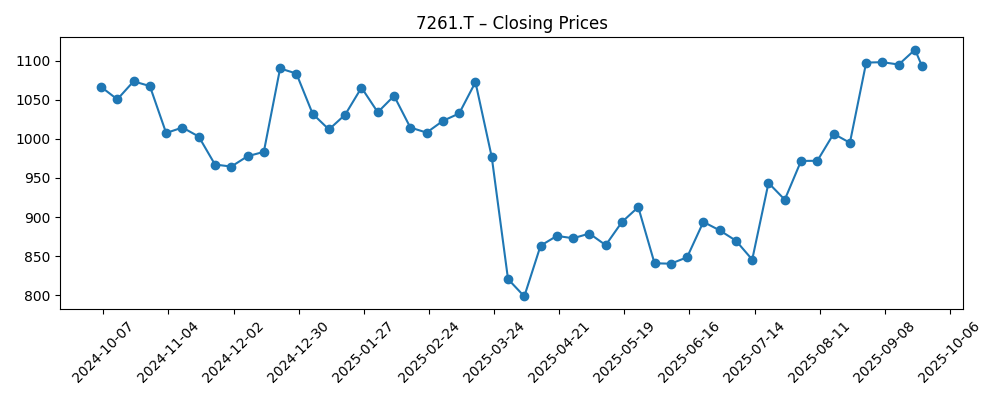
- Share price: ¥1,093 (Sep 24); 52‑week range ¥723–¥1,184; 50‑DMA ¥989.97; 200‑DMA ¥960.84; 52‑week change +0.27%.
- Valuation: Approx. P/B ≈ 0.40 (price ¥1,093 vs. BVPS ¥2,729.79); P/S ≈ 0.14 (price vs. revenue per share).
- Market cap: ≈ ¥689.4B (¥1,093 × 630.71M shares outstanding).
- Balance sheet: Cash ¥1.01T; debt ¥716.59B; net cash ≈ ¥293.4B; current ratio 1.52; debt/equity 41.23%.
- Dividend: ¥55 per share; forward yield 4.94%; payout ratio 30.41%; ex‑dividend date 9/29/2025.
- Ownership/Trading: Float 561.27M; institutions 47.98%; insiders 6.73%; beta 0.48; avg 3‑mo volume 10.09M.
Share price evolution – last 12 months
Notable headlines
Opinion
Mazda’s spring drawdown to roughly ¥821 (week of March 30) and subsequent recovery near the 52‑week high suggest investors are discounting stabilization despite soft near‑term sales. The stock now sits above its 50‑ and 200‑day moving averages, a technical backdrop often associated with improving sentiment. Yet the fundamentals frame the challenge: a negative operating margin alongside a positive but slim net margin implies that cost discipline and mix improvements must do more heavy lifting. With a low beta and strong liquidity, the market appears willing to fund time for execution, especially with the dividend as a support. The near‑term task is to convert cash strength into operating traction without sacrificing pricing or brand equity.
The trailing revenue base of ¥4.91T provides scale, but the 8.8% year‑over‑year decline in the most recent quarter underlines demand and supply variability. For a manufacturer with a value‑leaning valuation profile (about 0.4x book and 0.14x sales based on the provided metrics), even modest margin repair can translate into notable equity leverage. Investors will watch whether product cadence, pricing discipline, and cost actions can lift operating performance from current levels. Mazda’s balance sheet latitude—net cash near ¥293B and positive levered free cash flow—offers optionality for targeted investment and shareholder returns while cushioning cyclical swings.
Dividend continuity is a visible anchor. With a forward yield of 4.94% and a payout ratio of 30.41%, the distribution appears covered by reported cash generation in the snapshot. That said, sustaining dividends through a period of negative operating margin requires either a turn in operations or continued reliance on working capital and non‑operating items, which is not a long‑term solution. The upcoming ex‑dividend date (September 29) may influence near‑term trading, but the three‑year trajectory depends more on whether Mazda can defend pricing, streamline costs, and lift utilization while avoiding inventory build‑ups in a choppy demand environment.
Valuation and risk perception form the final leg of the thesis. Trading at a discount to book value per share and with a subdued beta, Mazda is positioned as a defensive cyclical within autos. The share price recovery from March lows indicates the market is looking past the trough, but the durability of that view rests on evidence of operating normalization. If revenue stabilizes and margins move to clearly positive territory, the current setup could warrant a rerating. Conversely, if sales continue to contract and costs remain sticky, the balance sheet would need to carry more of the load, potentially capping multiples even as the dividend persists.
What could happen in three years? (horizon September 2025+3)
| Scenario | Three‑year narrative | What to watch |
|---|---|---|
| Best | Revenue stabilizes from the ¥4.91T TTM base and grows sustainably as product and geographic mix improve. Operating execution lifts margins from current negative territory, free cash flow remains positive, and dividend capacity expands. Valuation closes part of the discount to book and sales as confidence rebuilds. | Sequential margin improvement, steady quarterly revenues, disciplined capex, and continued net cash position. |
| Base | Macro and industry conditions remain uneven; Mazda prioritizes cost control and pricing discipline. Revenue trends flatten with periods of volatility, margins turn modestly positive, and the dividend is maintained. The stock tracks fundamentals with range‑bound multiples. | Monthly/quarterly sales run‑rate, inventory turns, and evidence of cost savings flowing through to EBIT. |
| Worse | Demand softens and/or costs remain elevated, keeping operating margin around breakeven or below. Cash cushions the impact but limits growth investment. Dividend flexibility narrows, and valuation remains anchored near balance‑sheet metrics. | Further revenue contraction, cash burn, higher working‑capital needs, and any pressure on credit metrics. |
Projected scenarios are based on current trends and may vary based on market conditions.
Factors most likely to influence the share price
- Pacing of margin repair from a −4.19% operating margin to clearly positive territory through costs and mix.
- Top‑line stability after a −8.80% quarterly revenue growth print, including channel inventory and regional demand.
- Capital allocation: sustaining the ¥55 dividend (4.94% yield) while funding product and efficiency investments.
- Balance‑sheet trends: preserving net cash (cash ¥1.01T vs. debt ¥716.59B) and maintaining liquidity (current ratio 1.52).
- Valuation re‑rating potential from low P/B (~0.40) and P/S (~0.14) if execution improves, versus downside if it stalls.
Conclusion
Mazda enters the next three years with two clear advantages—cash strength and valuation support—and one clear mandate: fix operations. The company’s TTM revenue base of ¥4.91T, positive levered free cash flow, and net cash position provide flexibility to navigate uneven demand while funding efficiency moves. Yet the operating line is the swing factor; with a negative operating margin and a slim net margin, evidence of sustained improvement will be needed to justify a durable re‑rating. The stock’s recovery from the March lows, coupled with trading above the 50‑ and 200‑day averages, shows sentiment can turn quickly, but it will track proof points on sales stability, cost control, and capital discipline. For now, the dividend (4.94% yield) offers income support. Over a three‑year horizon, Mazda’s path likely hinges on converting balance‑sheet strength into operating momentum without diluting brand positioning or returns.
This article is not investment advice. Investing in stocks carries risks and you should conduct your own research before making any financial decisions.