


Nissan Motor Co. (7201.T) enters September 2025 with mixed signals: trailing twelve‑month revenue of ¥12.34T alongside an operating margin of -2.92% and a TTM net loss of ¥815.22B. Quarterly revenue declined 9.70% year over year, while operating cash flow remains positive at ¥923.06B but levered free cash flow is negative at ¥2.74T. The balance sheet shows ¥2.16T in cash versus ¥8.41T of total debt, a current ratio of 1.49, and debt/equity of 160.43%. Shares closed the latest week at ¥373.10, down 10.07% over 52 weeks, versus a 16.33% rise in the S&P 500; the 52‑week range is ¥299.00–¥553.70. Headlines include reports that Nissan may cut LEAF production and a volatile analyst stance with both an upgrade and a later downgrade in September. This note outlines key drivers and a three‑year outlook.
Key Points as of September 2025
- Revenue: TTM revenue at ¥12.34T; quarterly revenue growth (yoy) at -9.70% indicates demand and mix headwinds.
- Profit/Margins: TTM operating margin -2.92%; net income -¥815.22B; gross profit ¥1.53T; EBITDA ¥656.98B; reported profit margin 0.00%.
- Cash flow: Operating cash flow ¥923.06B; levered free cash flow -¥2.74T, highlighting investment and financing burdens.
- Balance sheet: Cash ¥2.16T vs total debt ¥8.41T; current ratio 1.49; debt/equity 160.43% underscores leverage.
- Share price: Latest close ¥373.10; 52‑week range ¥299.00–¥553.70; 50‑day MA ¥336.93; 200‑day MA ¥377.00; 52‑week change -10.07%.
- Dividend: Forward annual dividend rate ¥20 (4.87% yield); trailing dividend was 0.
- Analyst view and sentiment: Reports of an upgrade (early Sept) followed by a downgrade (mid‑Sept); short interest reportedly increased.
- Ownership: Insiders hold 39.65%; institutions 16.97%—a stable core with modest institutional sponsorship.
- Market context: S&P 500 up 16.33% over the same period, underscoring Nissan’s relative underperformance.
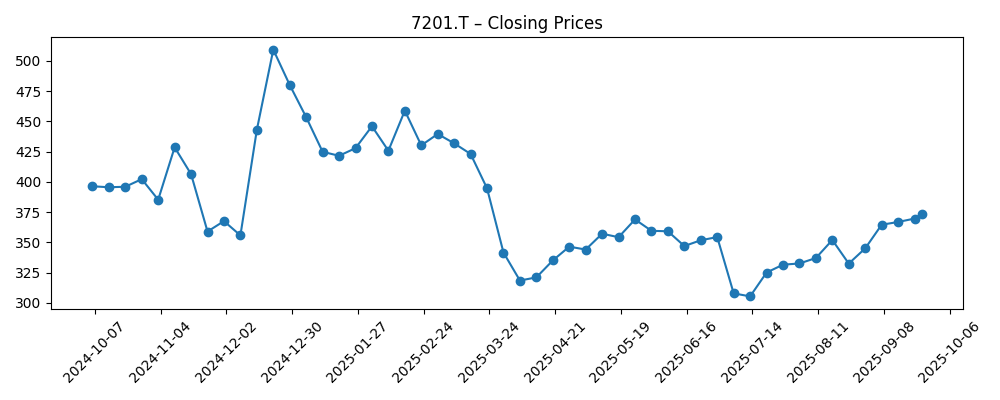
Share price evolution – last 12 months
Notable headlines
- Nissan may cut LEAF model production in half
- Nissan Motor (OTCMKTS:NSANY) Upgraded at Wall Street Zen
- Nissan Motor (OTCMKTS:NSANY) Lowered to “Sell” Rating by Wall Street Zen
- Nissan Motor Co. (OTCMKTS:NSANY) Sees Large Increase in Short Interest
- Head‑To‑Head Contrast: BYD & Nissan Motor
Opinion
Price action over the past year suggests the market is unconvinced that a clean earnings recovery is imminent. The stock is down 10.07% over 52 weeks against a 16.33% S&P 500 rise, and it trades around ¥373.10—near the 200‑day moving average of ¥377.00, with the 50‑day at ¥336.93. The path from December’s strong weekly close (¥509.20 on 2024‑12‑22) to April’s drawdown (¥318.40 on 2025‑04‑06) and July’s trough (¥305.30 on 2025‑07‑13) reflects shifting expectations on margins and EV execution. The subsequent grind higher to late‑September levels implies that some investors see stabilization potential. Yet the technical setup remains mixed: the 50‑day sits below the 200‑day, and the 52‑week range of ¥299.00–¥553.70 underscores volatility. To break higher sustainably, investors will likely need evidence of revenue stabilization and a credible margin plan.
Reports that Nissan may cut LEAF production point to a pragmatic reset in the EV lineup, aligning output with demand while prioritizing profitability. In a market where EV growth is uneven and incentives are evolving, right‑sizing helps protect pricing and capital efficiency, but it can also compress near‑term volumes and utilization. The trade‑off is clear: fewer lower‑margin units today in exchange for improved average margins and working‑capital discipline. Competitive comparisons—such as recent head‑to‑heads against faster‑growing EV peers—highlight the urgency of focused product roadmaps and cost control. Execution risk is non‑trivial; however, a disciplined portfolio approach can be a positive inflection if supported by clearer model cadence and procurement savings. Investors should watch for signals that production adjustments translate into improved gross profit conversion rather than merely lower throughput.
Financially, Nissan’s TTM operating margin is -2.92% with a TTM net loss of ¥815.22B, but operating cash flow is positive at ¥923.06B. The tension between cash generation and earnings, combined with levered free cash flow of -¥2.74T and total debt of ¥8.41T, places a premium on capital allocation. The forward dividend (¥20, 4.87% yield) is attractive on paper, yet sustainability depends on margin repair and capex discipline. Liquidity is supported by ¥2.16T in cash and a current ratio of 1.49, but deleveraging would likely require better operating leverage and selective investment. Insider ownership of 39.65% can align long‑term incentives, while institutional ownership of 16.97% suggests room for broader sponsorship—conditional on improved fundamentals. Near‑term priorities: stabilize revenue decline (‑9.70% yoy in the latest quarter) and convert cost actions into durable operating margin gains.
Sentiment remains fragile. Within two weeks in September, one outlet moved from an upgrade to a later downgrade, and reports flagged increased short interest. That swing mirrors the push‑pull in the narrative: restructuring benefits and cost control versus EV competition and macro sensitivity. A constructive turn likely requires three proofs: clearer demand visibility, consistent execution on an EV and hybrid portfolio that protects pricing, and sequential improvement in operating margin. If those arrive, the shares could reclaim a more constructive trend; absent that, the stock may hover around longer‑term averages while investors wait for evidence. Over a three‑year horizon, the path is less about heroics and more about steady, demonstrable progress—flattening the revenue line, nudging margins into the black, and translating operating cash flow into improved free cash flow while maintaining a balanced dividend policy.
What could happen in three years? (horizon September 2025+3)
| Scenario | Narrative |
|---|---|
| Best case | Model lineup reset boosts mix; EV and hybrid portfolio hits targeted price points with disciplined incentives. Revenue stabilizes, operating margin turns positive, operating cash flow consistency enables deleveraging and a sustainable dividend. Shares are rewarded with a higher quality‑of‑earnings perception. |
| Base case | Selective production cuts and cost programs prevent further deterioration but progress is gradual. Revenue trends flatten, margin improvement is modest, and free cash flow oscillates around breakeven after capex. Dividend policy remains cautious and tied to cash conversion. |
| Worse case | Competitive pressure and soft demand prolong negative operating leverage. EV mix remains margin‑dilutive, free cash flow stays negative, and leverage limits strategic flexibility. Dividend becomes a source of uncertainty; valuation remains constrained by execution risk. |
Projected scenarios are based on current trends and may vary based on market conditions.
Factors most likely to influence the share price
- Pace of margin repair and cost savings flowing to operating profit from production and procurement actions.
- Demand and pricing in core markets for EVs and hybrids, including any production adjustments to align with orders.
- Free cash flow trajectory versus capex needs and implications for the forward dividend (¥20; 4.87% yield).
- Balance‑sheet management and refinancing conditions given total debt of ¥8.41T and cash of ¥2.16T.
- Shifts in sentiment, including short interest trends and analyst stance following recent mixed rating signals.
Conclusion
Nissan’s three‑year setup is a balance of self‑help and external forces. On the one hand, reported steps to recalibrate EV output suggest a focus on profitability over volume, and positive operating cash flow provides a base from which to execute. On the other, TTM operating margin of -2.92%, a TTM net loss of ¥815.22B, and levered free cash flow of -¥2.74T underscore the distance yet to travel. Share performance—down 10.07% over 52 weeks despite a wider market gain—reflects this uncertainty. We think the stock can work if management demonstrates sequential revenue stabilization and consistent conversion of cost actions into improved margins, allowing free cash flow to trend toward balance while maintaining a prudent dividend. Absent that, shares may remain range‑bound around longer‑term averages as investors seek stronger evidence of durable recovery.
This article is not investment advice. Investing in stocks carries risks and you should conduct your own research before making any financial decisions.