


Volvo Car AB (VOLCAR-B.ST) enters the next three years balancing cyclical headwinds with strategic pivots. Shares trade around 19.31 as of September 24, 2025, down 26.68% over 12 months, with the 50-day/200-day averages at 19.25 and 20.09, respectively. Revenue over the last 12 months totaled 381.34B, yet profitability remains thin: profit margin 0.11% and operating margin -10.90%. Cash of 56.24B sits against 40.5B of debt, a current ratio of 1.02, and strong operating cash flow of 51.51B offset by -14.37B in levered free cash flow. The most consequential development is a move to expand U.S. production and launch a new hybrid model aimed at countering tariffs—a step that could stabilize demand and reduce policy risk while management navigates slower quarterly revenue growth (-7.80% YoY).
Key Points as of September 2025
- Revenue: 381.34B (ttm); Revenue per share: 128.25; Quarterly revenue growth: -7.80% YoY.
- Profit/Margins: Profit margin 0.11%; Operating margin (ttm) -10.90%; Gross profit 65.86B; EBITDA 16.16B; Net income to common 0.403B.
- Cash & Liquidity: Total cash 56.24B; Total debt 40.5B; Current ratio 1.02; Operating cash flow 51.51B; Levered free cash flow -14.37B.
- Share price: 19.31 (Sep 24, 2025); 52-week range 15.94–28.94; 52-week change -26.68%; 50-day MA 19.25; 200-day MA 20.09; Beta 1.01.
- Trading activity: Avg vol (3m) 4.3M; Avg vol (10d) 3.6M.
- Ownership: Insiders 78.68%; Institutions 16.16%; Shares outstanding 2.96B; Float 620.92M; Implied shares 3.02B.
- Balance-sheet value: Book value per share 46.10; the stock trades below BVPS at recent prices.
- Capital returns: No trailing dividend reported; payout ratio 0.00%.
- Market cap/analyst view: Market capitalization and consensus ratings not provided in this dataset.
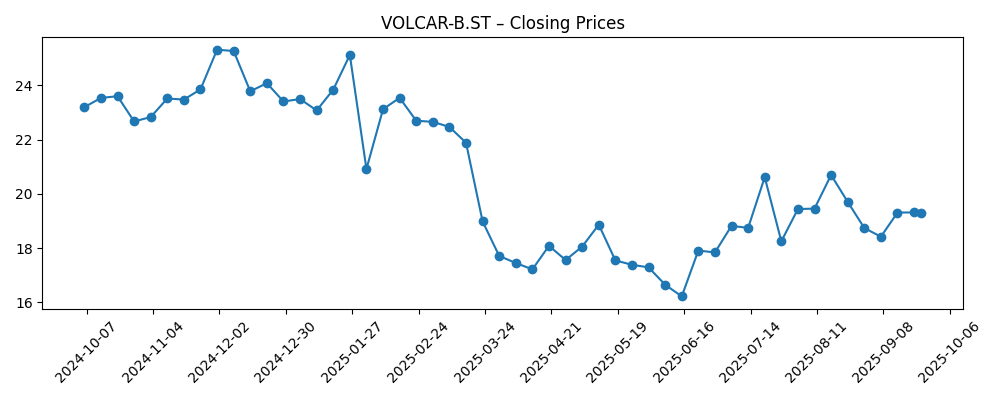
Share price evolution – last 12 months
Notable headlines
Opinion
Volvo Car AB’s decision to expand U.S. production and introduce a new hybrid model strikes at two problems at once: policy uncertainty and uneven EV demand. Domestic manufacturing can hedge tariff exposure while shortening logistics and potentially unlocking incentives or friendlier local content rules. Hybrids, meanwhile, offer a bridge product for consumers wary of charging infrastructure or price points of full EVs. The trade-off is margin complexity. Hybrids add technology cost and supply-chain coordination, while near-term scale is often insufficient to dilute overhead. With a profit margin of 0.11% and operating margin of -10.90%, any launch missteps could prolong negative operating leverage. Still, a geographically diversified production footprint can stabilize deliveries and reduce the volatility that has pressured the shares.
The share price tells a cautious story. After sliding to mid-June lows near the 52-week floor and then rebounding, the stock now hovers around its 50-day moving average and below its 200-day average, reflecting a market that sees progress but awaits proof of sustained earnings traction. The 52-week change of -26.68% and a beta of 1.01 imply that company-specific execution, not market swings, has dominated returns. Trading volumes have normalized, suggesting no capitulation but also no conviction breakout. For long-horizon investors, that sets a bar: demonstrate improved unit economics and cash conversion, not just headline-driven momentum from production shifts.
Funding and flexibility are crucial. Volvo’s 56.24B in cash and 40.5B in debt provide room to reorder the footprint, but free cash flow is negative on a levered basis (-14.37B) even as operating cash flow is robust (51.51B). That gap points to financing costs and investment intensity, typical of an industry refit cycle. The current ratio at 1.02 indicates tight—but manageable—near-term liquidity. High insider ownership (78.68%) reduces free float, which can dampen volatility in normal periods yet amplify moves around inflection points. Against this backdrop, incremental margin wins from localized sourcing, disciplined pricing, and selective model mix could compound quickly, while execution slippage could extend cash burn.
Strategically, hybrids can defend share while EV adoption normalizes, but the company will still need credible cost-downs and software-driven features to compete on total cost of ownership. If U.S. output scales smoothly, the tariff hedge may translate into steadier North American sales and better factory utilization. However, revenue growth was -7.80% YoY in the latest quarter, underscoring that the demand backdrop is not a tailwind. The investment case over three years hinges on converting today’s operational reshaping into margin repair—ideally moving from negative operating margins toward low-single-digit positives before any valuation re-rating. Trading below book value per share (46.10) adds a support narrative, but the market will likely demand clear improvement in earnings quality first.
What could happen in three years? (horizon September 2028)
| Scenario | Narrative |
|---|---|
| Best case | U.S. capacity ramps on time; hybrid mix unlocks pricing power and higher utilization; cost-downs narrow BOM gaps; operating margin turns sustainably positive; cash conversion improves and levered free cash flow moves positive; stock re-rates toward book-driven valuation support. |
| Base case | Production shift reduces policy risk but mix/price offset remains partial; margins hover near break-even with gradual improvement; operating cash flow stays solid but investment needs keep free cash flow choppy; shares track fundamentals with range-bound trading versus long-term averages. |
| Worse case | Ramp delays and supply constraints erode launch benefits; demand softness persists; pricing pressure widens losses; liquidity tightens as negative free cash flow extends; sentiment weakens and the stock tests its lower trading range. |
Projected scenarios are based on current trends and may vary based on market conditions.
Factors most likely to influence the share price
- Execution of U.S. production expansion and hybrid model rollout (timelines, quality, utilization).
- Margin trajectory from cost control, model mix, and localized sourcing versus input inflation.
- Trade policy and tariff developments affecting import economics and cross-border supply chains.
- Cash flow durability relative to capex and financing costs, given negative levered free cash flow.
- Demand elasticity for hybrids and EVs amid macro conditions and consumer incentives.
- Liquidity and trading dynamics shaped by high insider ownership and limited free float.
Conclusion
Volvo Car AB is using a pragmatic playbook for a transitional auto cycle: de-risk exposure to tariffs by building more in the U.S., and meet consumers where they are with a new hybrid model. The financial base—56.24B cash, 40.5B debt, and strong operating cash flow—buys time, but thin profitability (0.11% profit margin; -10.90% operating margin) and negative levered free cash flow mean that time must be used to repair unit economics. Shares have lagged over 12 months and trade below book value per share, signaling skepticism that execution will translate into earnings. Over the next three years, the pathway to a better multiple likely requires consistent margin improvement, steadier free cash flow, and proof that localized production yields sustainable cost and pricing advantages. If those arrive, the stock could escape its range; if not, it may remain tethered to book value and macro swings.
This article is not investment advice. Investing in stocks carries risks and you should conduct your own research before making any financial decisions.