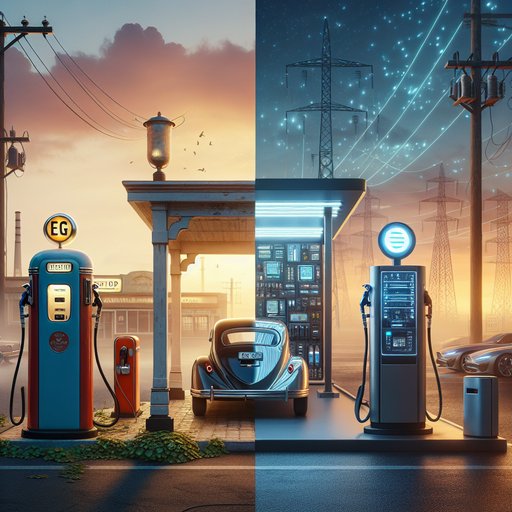
Gasoline retail matured over a century around high-throughput pumps and simple, redundant equipment. Public EV charging is compressing that buildout into a decade, with tighter power, software, and land-use constraints. Comparing the two reveals why EV sites look and perform differently: uptime is defined by networked electronics as much as hardware, charging speeds are capped by vehicle acceptance and taper, multi‑megawatt grid connections are non-trivial, and dwell times reshape real estate. Recent policy—NEVI’s 97% uptime rule, state reporting, and SAE J3400 (NACS) adoption—shows reliability and interoperability becoming central as DC fast charging moves from pilot to utility-grade service.
The historical gas station model optimized for throughput. A typical forecourt with 6–12 nozzles, each serving a vehicle in 3–5 minutes, can process 70–140 cars per hour on a sub-acre parcel, fed by tanker trucks and simple pumps. By contrast, EV networks are scaling in an era where vehicles vary widely in charge acceptance, sessions last 20–35 minutes on highways, and each stall is a networked power converter tied to utility infrastructure. The opportunity is that EV fueling is inherently distributable: much of the energy can be delivered off-peak at home or work (6–11 kW AC), easing highway peak demand.
The challenge is that long-distance travel still depends on reliable DC fast charging (≥150 kW), and that requires utility-grade power, software uptime, and land layouts that fit longer dwell times and amenities. Uptime. Gas stations achieve effective availability well above 99% by design: multiple nozzles per dispenser, gravity/positive-displacement pumps, and minimal software in the critical path. If one nozzle fails, others keep operating.
EV charging adds more failure modes: payment/authentication, communications, contactors, cooling, and firmware. U.S. federal NEVI rules require 97% uptime per charging port, measured over 30 days, and multiple states began publishing operator-reported reliability in 2024–2025. Independent user surveys (e.g., J.D.
Power through 2024) have reported 15–20% unsuccessful charging attempts on public DC fast networks, driven by payment, connector, and power faults—figures that are improving but still above gas retail norms. Some networks (notably Tesla’s Supercharger) have reported >98–99% uptime, though definitions differ, underscoring the push for standardized reporting. Charging speed and power delivery. A modern DC fast stall is typically rated 150–350 kW; real session averages are lower (70–150 kW) due to vehicle limits and taper above ~60–80% state of charge.
800 V vehicles can sustain 200–320 kW longer; 400 V vehicles often peak 120–250 kW. By comparison, a gasoline nozzle at 8–10 gallons/minute dispenses the energy equivalent of roughly 270–340 kWh per minute—tens of megawatts of chemical energy flow—with minimal site electrical demand. EV sites aggregate large electrical loads: a four-stall NEVI-compliant site (4 × 150 kW) requires roughly 600–900 kW of coincident capacity; larger plazas with 8–16 high-power stalls need 1–3+ MVA service, liquid-cooled cables, and sometimes on-site storage (0.5–3 MWh) to manage demand charges and weak feeders. This grid interface—not the charger cabinet alone—often sets the pace of rollout.
Land use and throughput. A conventional urban gas station fits on ~0.5–1.5 acres with short dwell times and high vehicle turnover. EV highway sites with 8–12 DC stalls, ADA-accessible bays, a transformer pad, and power electronics can fit on ~0.2–0.6 acres, but throughput is lower: at 25–30 minutes per session, a stall serves ~2 vehicles/hour, so an 8-stall site might process 120–200 vehicles/day without queuing, unless paired with additional stalls. The spatial signature therefore shifts from small, high-throughput nodes to distributed hubs at retail parking lots, travel plazas, and depots—where longer dwell aligns with food, restrooms, and shopping.
Curbside and workplace Level 2 (6–19 kW) consume little extra land but are unsuitable for highway peaking. Rollout milestones and constraints. Gas retail densified rapidly after the 1910s with minimal grid dependencies; product arrived by truck, and regulation focused on fire safety and underground storage tanks. EV networks in 2024–2025 are converging on interoperability (SAE J3400/NACS alongside CCS), minimum 150 kW per port for federally funded sites, and public uptime reporting (e.g., California’s reliability transparency rules).
Practical bottlenecks include transformer lead times, utility interconnection studies, right-of-way permissions, and demand charge economics. Networks are deploying higher-reliability 350–400 kW hardware, liquid-cooled cables, better payment stacks, and onsite batteries to smooth loads. Early NEVI-funded sites are appearing across multiple states, with four-port minimums and 97% uptime obligations backed by service-level agreements. Implications.
EV charging will not mirror gas stations one-for-one. Expect fewer ultra-high-throughput highway nodes and more distributed charging embedded in where vehicles dwell. Policy that standardizes uptime reporting, accelerates interconnections, and aligns tariffs with high-load-factor sites will raise effective availability to gas-like levels. Interoperable connectors and robust payment reduce soft failures.
Land-use planning that co-locates 1–3 MVA interconnections with amenities, plus incentives for home and workplace charging, will keep peak highway demand manageable. The end state is a blended system: home/work AC for most energy, plus reliable, utility-grade DC hubs for trips—optimized for power quality and user experience rather than sheer pump count.

