


Rivian Automotive (RIVN) enters September 2025 with early signs of operating progress but a runway that still depends on disciplined execution. Trailing‑12‑month revenue stands at $5.15B, while losses remain steep (profit margin −68.06%, operating margin −85.50%) and gross profit is −$222M. Liquidity is solid, with $7.51B in cash, a 3.44 current ratio, and $4.9B in total debt; operating cash flow has turned positive at $183M, though levered free cash flow is −$742.5M. Shares recently traded near $15.46, up 40.80% over 12 months, within a $9.50–$17.15 range and above 50‑ and 200‑day averages of $13.26 and $13.19. Short interest is notable at 14.74% of float. Strategic context includes cost‑cutting layoffs and an initial $1 billion Volkswagen partnership ahead of the R2, setting the stage for a pivotal three‑year stretch.
Key Points as of September 2025
- Revenue: $5.15B (ttm); quarterly revenue growth (yoy) at 12.5%.
- Profitability: Profit margin −68.06%; operating margin −85.50%; EBITDA −$2.73B; gross profit −$222M (ttm).
- Liquidity & leverage: Cash $7.51B; current ratio 3.44; total debt $4.9B; debt/equity 80.57% (mrq).
- Cash flow: Operating cash flow $183M (ttm) vs. levered free cash flow −$742.5M.
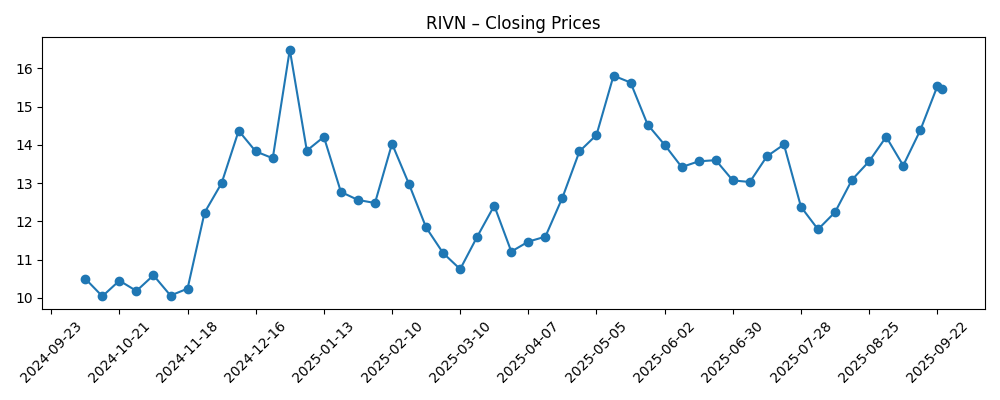
- Share price: Recent close ~$15.46 (Sep 24, 2025); 52‑week range $9.50–$17.15; 50‑/200‑day MAs $13.26/$13.19; beta 1.81; 52‑week change +40.80%.
- Ownership & short interest: Shares outstanding 1.21B; float 793.51M; insiders 34.48%; institutions 43.68%; short % of float 14.74%; short ratio 3.56.
- Strategy & product: Cost‑cutting layoffs and an initial $1B Volkswagen partnership ahead of R2.
- Analyst/investor discourse: High‑profile debate on a path to $30 and incremental institutional interest reported.
Share price evolution – last 12 months
Notable headlines
- Rivian Balances Layoffs and $1 Billion Volkswagen Investment Ahead of R2 Launch
- Rivian Stock: How RIVN Doubles To $30
- Rivian Automotive, Inc. $RIVN Stock Position Increased by Swedbank AB
Opinion
Rivian’s share price has climbed back toward the upper end of its recent range, with the 50‑ and 200‑day moving averages clustered around the low‑$13s. That setup, alongside a 52‑week change of +40.80%, suggests sentiment has mended since last year’s trough. However, volatility remains elevated (beta 1.81) and short interest at 14.74% of float underscores a divided view on execution. Over the next three years, the stock’s direction is likely to mirror progress on unit economics and production reliability. Without explicit volume guidance here, investors can still track the financial tells: a turn to positive gross profit, sustained operating cash generation beyond the current $183M, and narrowing operating losses. If those metrics trend consistently, technicals may matter less as the market de‑risks the story and compresses the discount applied to future models.
The Volkswagen partnership—initially $1 billion—arrives as Rivian streamlines via layoffs, linking capital, software collaboration, and cost discipline ahead of R2. The significance is less the headline figure and more the validation and potential technology leverage: software, electronics, and manufacturing know‑how that can shorten learning curves and reduce bill‑of‑materials over time. In an EV market where pricing pressure is persistent, a capable partner can help Rivian preserve brand positioning while attacking cost. The risk, of course, is integration complexity: partnerships consume management bandwidth, and benefits rarely show up all at once. Over the next 12–24 months, evidence of joint deliverables, improved reliability, and a tighter cost stack will be the proof points that justify the strategic trade‑offs embedded in the deal.
Financially, the task is straightforward to state and hard to achieve: move gross profit from −$222M (ttm) to meaningfully positive, sustain and expand operating cash flow from $183M, and progressively narrow EBITDA losses (−$2.73B ttm). The balance sheet provides optionality—$7.51B in cash and a 3.44 current ratio—yet leverage at $4.9B and an −85.50% operating margin highlight why cost control and mix improvement remain non‑negotiable. If Rivian can ramp new models like R2 without deep discounting, mix and scale should improve unit economics. If demand softens or incentives intensify, the company may have to lean harder on cost reductions, software monetization, and production efficiency to protect margins. The next phase is less about top‑line growth for its own sake and more about quality of revenue.
Investor positioning is polarized. Notable institutional adds, such as the reported increase by Swedbank AB, signal selective confidence, while short interest near 15% of float implies ample skepticism. That push‑pull can amplify moves around catalysts—production milestones, software updates, partnership progress, and quarterly cash‑flow inflections. A credible glidepath to breakeven gross margin and narrowing operating losses could force bears to reassess, while any stumble on product timing or quality would quickly reinforce the downside narrative. Over three years, Rivian’s equity story is likely to transition from promise to proof. Execution that validates the business model could compress the risk premium; conversely, delays or rising cash burn would revive dilution fears and keep the valuation anchored despite strategic headlines.
What could happen in three years? (horizon September 2028)
| Scenario | Description | Key triggers by 2026–2028 | Implications for RIVN shares |
|---|---|---|---|
| Best | Rivian executes R2 smoothly, benefits from Volkswagen collaboration, and achieves sustained positive gross profit with improving operating cash flow. | On‑time product milestones; bill‑of‑materials reductions; stable pricing; visible software/features that enhance margins. | Re‑rating as investors discount long‑term profitability; volatility fades as short interest declines. |
| Base | Progress is steady but uneven; gross profit turns positive and losses narrow, though competitive pricing and ramp frictions persist. | Incremental cost wins; manageable recalls; partnerships deliver modest benefits; occasional capital market taps. | Range‑bound trading with bursts around catalysts; valuation tracks execution rather than narrative. |
| Worse | Delays and cost overruns; market demand softens; margins lag and cash burn intensifies, raising financing concerns. | Slip in product timing/quality; heavier discounting; slower partnership impact; tougher credit conditions. | Multiple compression and retest of prior lows; elevated dilution risk keeps a ceiling on rallies. |
Projected scenarios are based on current trends and may vary based on market conditions.
Factors most likely to influence the share price
- Execution on cost reductions and bill‑of‑materials, reflected in a turn to positive gross profit and improving operating margins.
- Progress and deliverables from the Volkswagen partnership, especially software/electrical architecture gains.
- Demand elasticity and pricing in the EV market, including competitive launches and incentive intensity.
- Capital needs and balance‑sheet flexibility given total debt of $4.9B and current cash of $7.51B.
- Production quality, warranty costs, and any recall or launch delays affecting brand and cash flow.
- Short‑interest dynamics (14.74% of float) that can amplify moves around catalysts.
Conclusion
Rivian stands at a hinge moment: revenue is growing, operating cash flow has flickered positive, and liquidity is ample, yet losses remain deep and execution risk is real. The next three years will likely be defined by improving unit economics, evidence that the Volkswagen collaboration yields tangible cost and software benefits, and a disciplined R2 rollout. If management converts today’s 12.5% revenue growth into sustained gross profit and steadily narrows operating losses, the equity story should de‑risk and broaden its shareholder base beyond momentum and short‑term traders. Conversely, delays, heavier discounting, or escalating cash burn would rekindle financing worries and keep valuation capped. With shares near $15.46 and a 52‑week range of $9.50–$17.15, the market is pricing a mix of promise and skepticism. Clear, repeatable operating improvements are the path to a durable re‑rating.
This article is not investment advice. Investing in stocks carries risks and you should conduct your own research before making any financial decisions.